
UK polls: Greens firmly in 4th place
While the BBC this week issued an apology of sorts (see below) for omitting the Green Party from a graph of a poll which showed them ahead of a party on the graph, the real culprit was the polling company YouGov, from which the BBC lazily copied their standard headline data.
YouGov are the most frequent pollster, releasing between 15 and 23 polls a month in conjunction with either the Sun or the Sunday Times. In their daily synopses of their polls, they provide the headline voting intention figures in short form, and on their blog they also provide a graph of polling averages for the past three months, such as the one below.
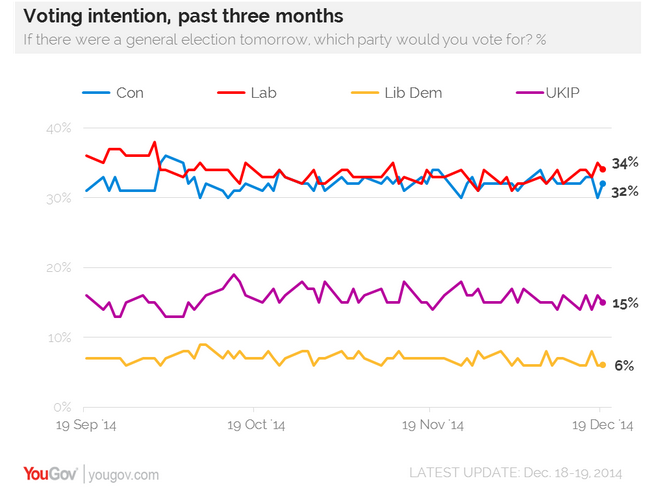
The one thing you will probably notice about all this is the absence of any figures for the Green Party. YouGov of course have those figures, but until this point have failed to include them in any consistent polling headlines.
They have, of course, highlighted Green polling figures at key points, including drawing level with the Lib Dems in September and passing the Lib Dems in October.
At least until now. Literally as I started writing this post, YouGov have issued produced a blog post highlighting how the Green Party averaged higher than the Lib Dems last week. Which now causes me a problem, as this post was slightly predicated on highlighting YouGov’s sidelining of the “#greensurge”. But look, now there they are, ahead of the Lib Dems on the chart!
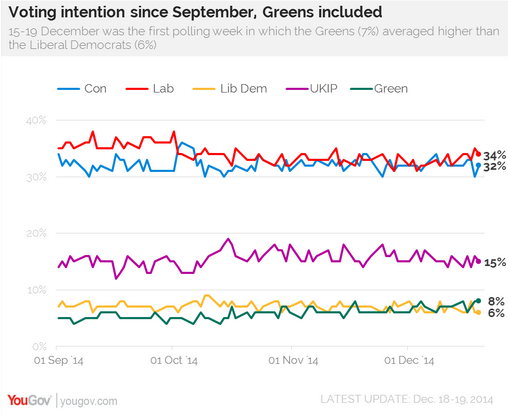
Whether this will be the start of things to come, time will tell (it certainly makes the graph look prettier). Unfortunately it appears in their last poll of the year that they have reverted back to ignoring the Greens again in the main headline presentations. Even so, despite this policy being difficult to understand, the Greens have a lot to like about the figures YouGov are providing.
In fact, the knowledge that they have polled on average higher than the Lib Dems last week is not the only good news. The other reason for this post was to highlight the fact that, not only have they averaged higher this week, YouGov figures show the Green Party has averaged higher than the Lib Dems for the whole of December.
The Green Party average for December is 6.9%. The Lib Dems by contrast are on 6.6%. As YouGov themselves acknowledge, it’s part of a growing trend. The graph below indicates this more clearly, with the dates that YouGov show the Greens drawing level and the ahead of the Lib Dems also identified.
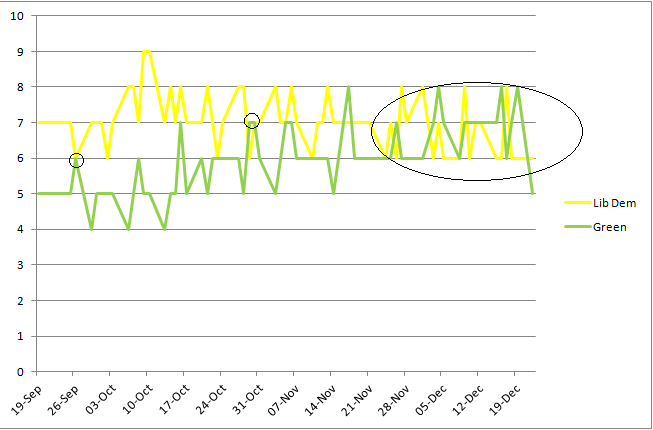
For November the Green Party was 6.2% and the Lib Dems were on 7.1% and in October it was 5.5% vs. 7.3%. The gap has been closing for the last few months (in a time where the party has grown by over 12,000 members), and it now looks set to continue to grow in the opposite direction.
| YouGov Lib Dem and Green Party monthly average | |||
| Month | Liberal Democrats | Green Party | Difference |
| December (to 22 December) | 6.6% | 6.9% | Green +0.3% |
| November | 7.1% | 6.2% | Lib Dem +0.9% |
| October | 7.3% | 5.5% | Lib Dem +1.8% |
In any case, it’s looking like it will be a good New Year for the Green Party, but there’s plenty to do to sustain and grow it in 2015.

Leave a Reply